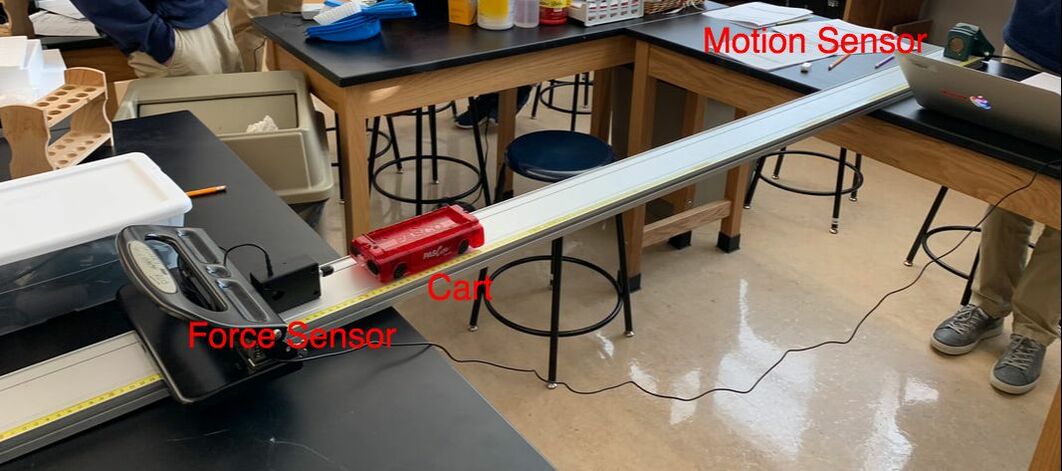
Experiment Setup - Cart moves away from motion sensor and towards a force sensor where it collides.
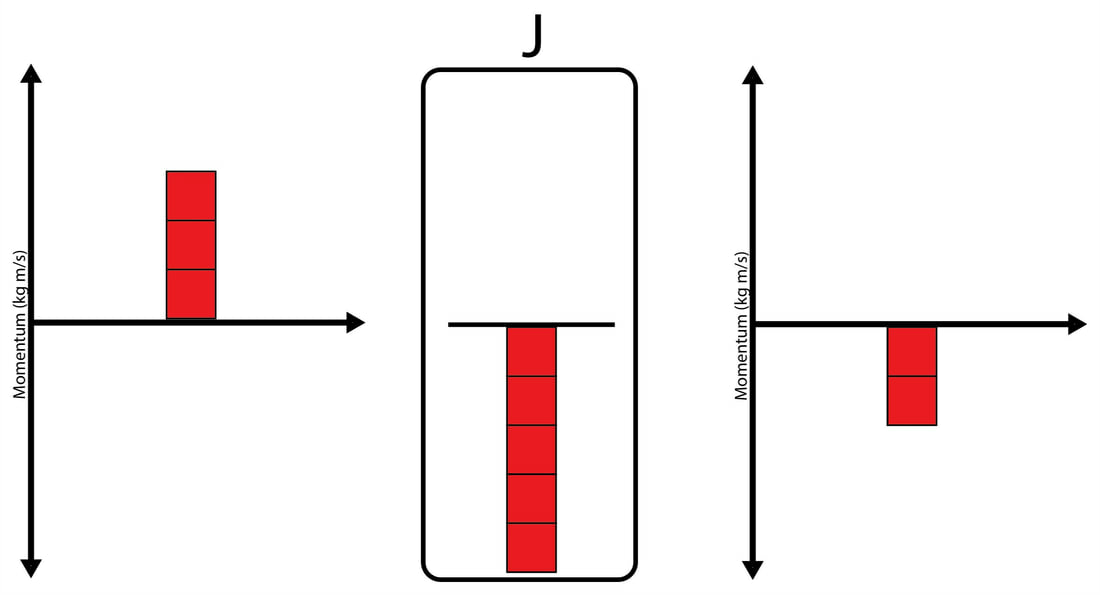
Our momentum bar chart shows that the initial momentum starts out positive, but after a negative impulse, the final momentum is negative.
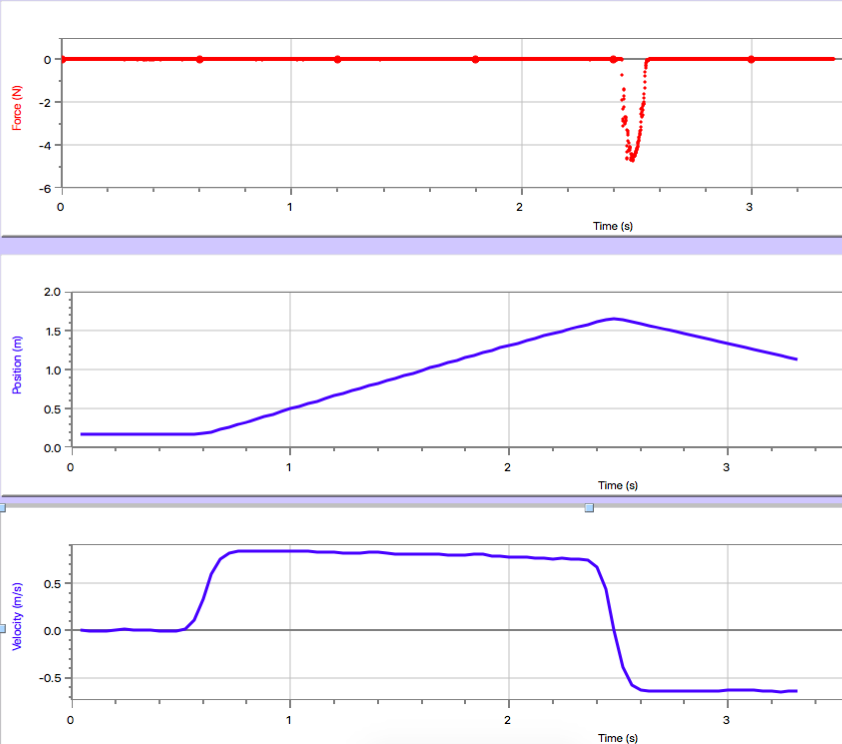
Graphs
Calculations
Initial Momentum = Initial Velocity * Mass = 0.8 m/s * 0.252 kg = 0.2016 kgm/s
Final Momentum = Final Velocity * Mass = -0.6 m/s * 0.252 kg = -0.1512 kgm/s
Impulse (change in momentum) = -0.1512 - 0.2016 = -0.3528 kgm/s
Impulse from Force vs. Time graph = Area under the graph = -0.3445 kgm/s
Percent Difference = |-0.3445+.3528|/.3528 = 2.35%
Final Momentum = Final Velocity * Mass = -0.6 m/s * 0.252 kg = -0.1512 kgm/s
Impulse (change in momentum) = -0.1512 - 0.2016 = -0.3528 kgm/s
Impulse from Force vs. Time graph = Area under the graph = -0.3445 kgm/s
Percent Difference = |-0.3445+.3528|/.3528 = 2.35%
Conclusion
This experiment is designed to show that impulse is the change in momentum as well as the area under a force time graph. We achieved this, as shown in the lab setup above, by pushing a low-friction cart down a low-friction track, where it collided with a force sensor and bounced back. We recorded the motion of the cart during the experiment with a motion sensor. We were able to collect data to make position time, velocity time, momentum time, and force time graphs. We could then estimate the initial and final velocity which with the mass of the cart, allowed us to find the initial and final momentum. With this we could find the impulse. You can also find impulse by finding the area under a force time graph, and we found that our results were only 2.35% off. Because this difference is so small we can conclude and confirm that impulse is the change in momentum as well as the area under the force vs. time graph.
The 2.35% difference could have come from multiple sources of uncertainty in the lab. One of these sources could have been friction. The low-friction carts and low-friction tracks are not completely frictionless, but they are designed to be as low as possible. This small amount of friction may have effected the data slightly. Another possible source of uncertainty could have been slight inaccuracy in Logger Pro. The force sensor has a very high polling rate as you can see from the points in the graph, but the curve isn't a perfect parabola which it should ideally be. This then effects the area under the graph, used to measure impulse.
The 2.35% difference could have come from multiple sources of uncertainty in the lab. One of these sources could have been friction. The low-friction carts and low-friction tracks are not completely frictionless, but they are designed to be as low as possible. This small amount of friction may have effected the data slightly. Another possible source of uncertainty could have been slight inaccuracy in Logger Pro. The force sensor has a very high polling rate as you can see from the points in the graph, but the curve isn't a perfect parabola which it should ideally be. This then effects the area under the graph, used to measure impulse.
